|
|
|
|
Time and Expense Report Dashboards
The time and expense report dashboards allow you to view detailed reports regarding planned, assigned and actual audit time and planned and actual expense information. The dashboard allows you to filter the reports in real time as well as export data to Excel or graphs to a picture file.
 Access the Time and Expense page.
- View Time Report Dashboard: Click Report /
 Time from the navigation bar at the top of the screen.
 - View Expense Report Dashboard: Click Report /
 Expense from the navigation bar at the top of the screen.
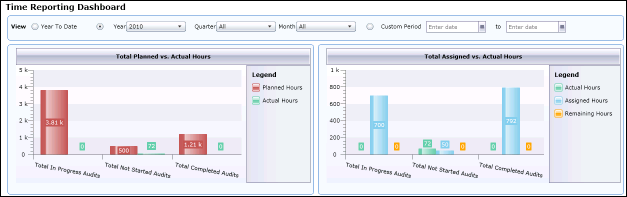
- The following reports are available in the dashboards:
Time Report Dashboard
Expense Report Dashboard
Total Planned Hours vs. Actual Hours
Total Planned vs. Actual Expenses
Total Planned Hours vs. Assigned Hours
Total Planned vs. Actual Expenses by Expense Type
Total Assigned Hours vs. Actual Hours
Actual Expenses by Auditor
Total Assigned Hours vs. Actual Hours
Actual Expenses by Phase
Actual Hours by Phase
- Filter the reports by year, quarter and month or specify a specific date period using the filter at the top of the screen.
- Double-click on a report to drill into the report details. Filter the audits in real time by audit name, status, origin and range of total plan hours/expenses, or click the check box to only view audits where total actual hours/expenses exceed total planned hours/expenses.
- The grid bottom of the screen shows the audit data that is being shown in the report. Click
 Filter next to the column to filter the data in the grid.
 - Click Export Data to export the data to an Excel spreadsheet, or Export Graph to export a screen shot of the graph to a picture file.